Beyond Documentation: Building a Data-Driven Test Lab for ElastiCache
Docs Confidence is that warm, fuzzy feeling you get after reading AWS whitepapers - right before your cache hits 99% memory, your p99 latency grows a tail, and your assumptions start to melt. It's not incompetence, it's the gap between documented behavior and observed behavior under your specific workload.
I built this repeatable ElastiCache benchmarking platform to close that gap with receipts: timestamped telemetry and exportable artifacts that stand up in a design review. This lab isn't just about Redis (or Valkey) as software, it's about the architectural decisions that land in production: which engine, which instance class, and which topology delivers the best outcome for the budget.
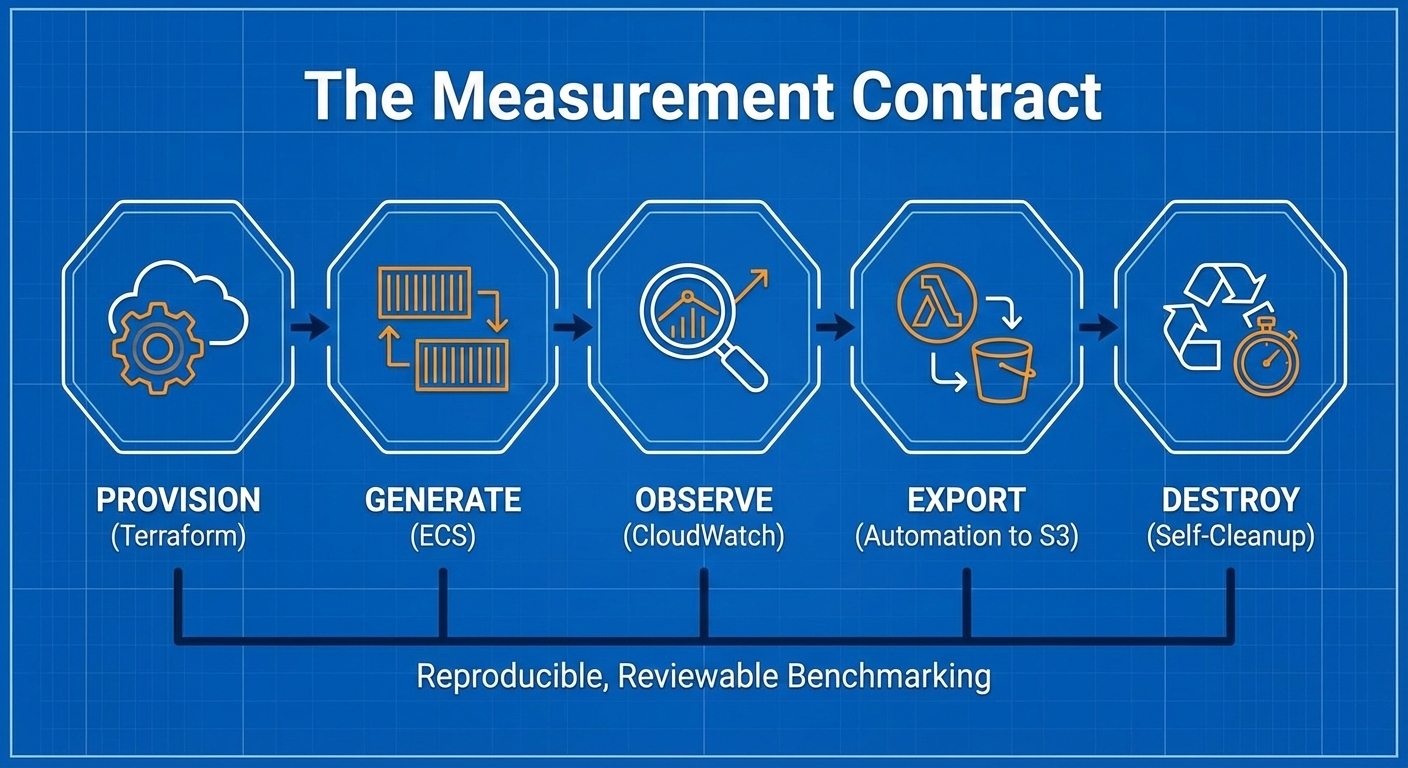
In engineering, a link beats a vibe. To make my results defensible, the workflow is intentionally boring and consistent:
- Provision: Terraform creates a deterministic environment.
- Generate: ECS produces controlled, reproducible load.
- Observe: CloudWatch captures the "ground truth."
- Export: Automation ships metrics/logs to S3 as immutable artifacts.
- Destroy: The lab cleans itself up to ensure cost-efficiency.
The point is comparability. When I change a variable-moving from a t3.medium to an m5.large or switching from Single Node to Cluster Mode-the evidence should make the impact on behavior obvious.
Observability is the Architecture
The first design decision wasn't picking an engine, it was deciding what evidence is required to trust the results. I structured the telemetry into four layers:
- Cache Telemetry- CPU, Memory, Connections, and Evictions.
- Load-Generator - To ensure the ECS task itself isn't the bottleneck.
- Timing Telemetry - Defining the "Stable Window" vs. the "Noise."
The Orchestration Tax
A "60-minute test" rarely produces 60 minutes of usable data. This is the Orchestration Tax.
A real cloud benchmark includes significant overhead: provisioning time, container scheduling, connection ramping, and the eventual teardown. In my early runs, a nominal 60-minute duration produced only ~40 minutes of steady-state data.
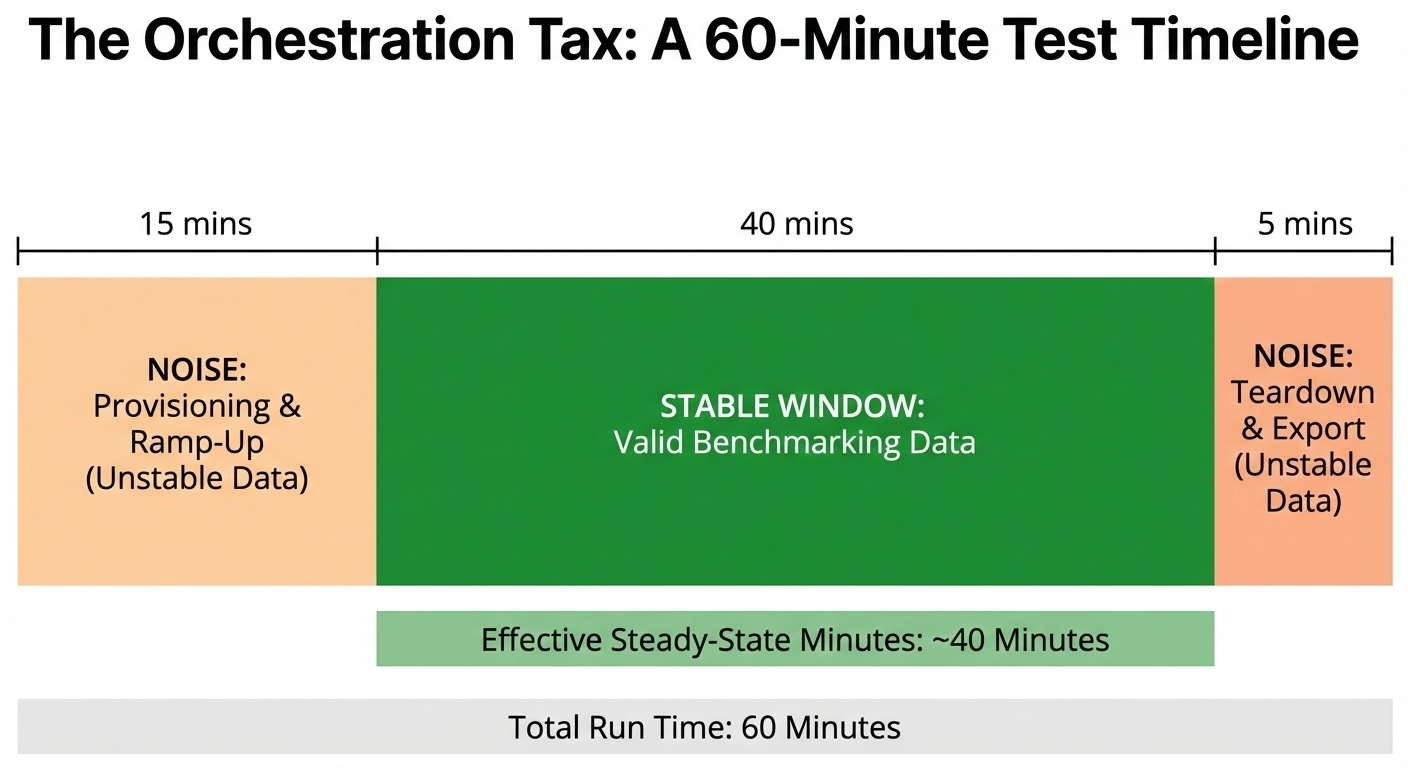
If you blend the "ramp-up" noise with "steady-state" performance, you tell the wrong story. You might see a latency spike and blame the cache, when in reality, it was just the ECS tasks negotiating connections. To get "Engineering Proof," you must account for the lifecycle of the infrastructure itself.
What Counts as "Valid Data"?
For this lab, I define a window as valid only when:
- Load has reached a stable plateau.
- The load generator is operating within its own limits.
The goal isn't to maximize runtime, it's to maximize the minutes where the data can defend itself.
The Metrics I Track
I focus on a specific subset of metrics to keep the benchmarks honest:
- Total time from terraform apply to CacheReady.
- How long until ECS reaches target throughput.
- The "Trusted Window."
- Crucial for Redis, as the engine can saturate even if the total Node CPU looks low.
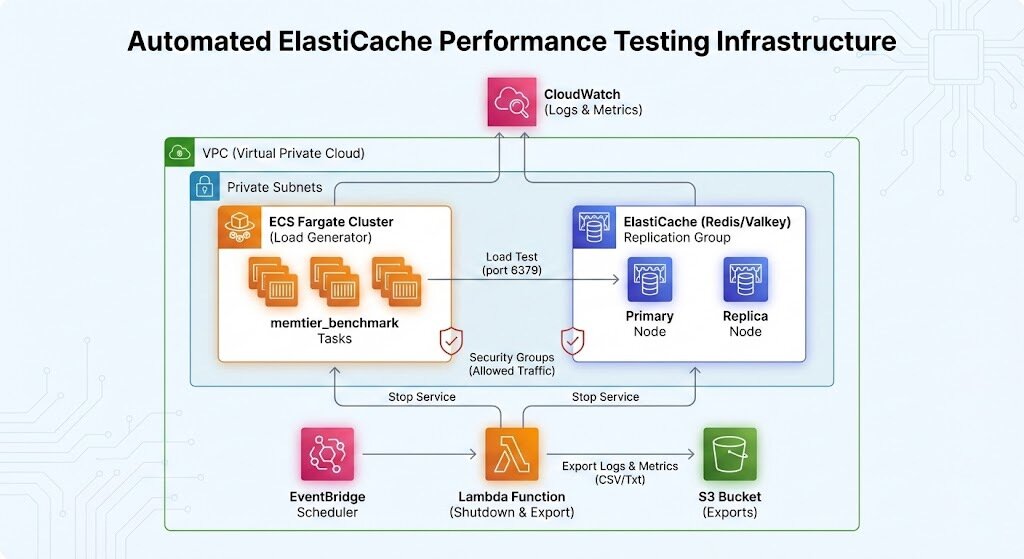
Architecture at a Glance
Conclusion
The value of this platform isn't that it "runs a test." It's that it makes benchmarking reviewable by design. We account for the orchestration tax, define the valid window, and capture the receipts.